Before Google Analytics, website owners used server access log files to see and understand their website data. These files show every action on the server, like page views, downloads, and errors. But log files had many problems, such as:
- They were hard to get and use,
- They needed technical skills and software,
- They did not show information like user details, sources, and goals,
- They did not consider caching, proxies, and bots, which could change or mess up the data,
- They did not give fast or interactive reports, making it difficult to improve website performance and user experience.
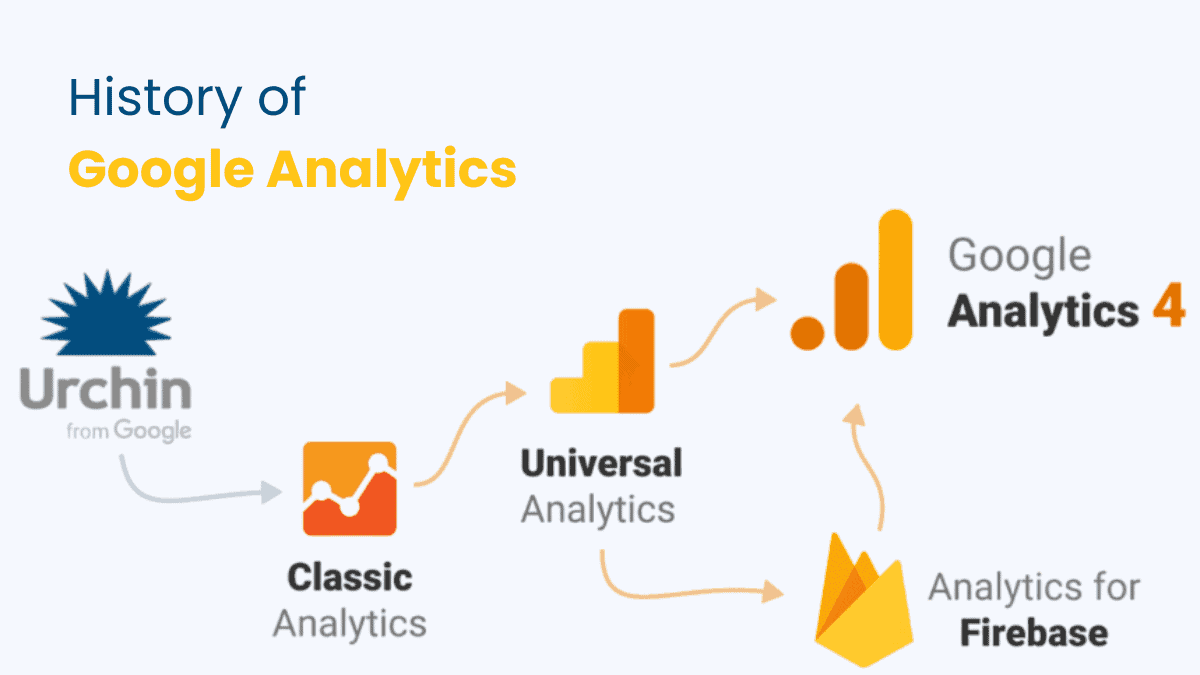
To solve these problems, web analytics companies began to offer online services that used JavaScript tags to gather and show website data. One of these companies was Urchin Software Corporation, which started in 1995 and developed Urchin on Demand, a web analytics service that later became Google Analytics.
Yes! You heard it right, Google Analytics used to be called Urchin. That’s how the journey of Google Analytics began.
Now Google Analytics is the most used web analytics service, giving information about website traffic, user behavior, marketing campaigns, and more. But how did it become such a strong and popular tool? What were the difficulties and chances that changed its growth? And what can we learn from its success?
In this article, we will explore the journey of Google Analytics and we will also try to answer all these questions. So get ready because this time it will be an amazing ride.
What is Google Analytics?
Google Analytics is a web service that helps website owners and managers see and understand how their website visitors use their online content.
Google Analytics helps users to:
- See and report website traffic, such as how many visitors, sessions, page views, bounce rate, and average session time.

- Study user behavior, such as what pages they go to, what actions they do, what goals they finish, and what groups they are in.
- Check marketing performance, such as what sources and mediums bring traffic, what campaigns make conversions, and what online advertising gives back.
- Improve website design, content, and function, such as how the website looks, moves, loads, and works, and how good, relevant, and fast the web pages are.
Below are the steps to create and set up Google Analytics:
Create a Google Analytics Account

- Visit the Google Analytics website (analytics.google.com).
- Sign in with your Google account or create a new one if necessary.
- Click on “Admin” and select the account under which you want to create the property.

- Click on “Create Property” and select “Web.”
Set Up a New GA4 Property

- Enter a name for your property (this could be your website name).
- Select the appropriate time zone and currency for reporting.
- Click on the “Next” button to fill in details about your business, then click “Create.”
Configure Data Streams
- In the property column, select “Data Streams” and then “Add stream.”
- Choose “Web” to add a website data stream.

- Enter your website’s URL and a stream name.

- Click “Create stream.” After this, you’ll receive a “Measurement ID” (similar to the UA code in Universal Analytics).

Install the GA4 Tracking Code
- From your newly created data stream, find the “Global site tag (gtag.js)” section under “Tagging instructions.”
- Copy the provided HTML tracking code.
- Paste this code into the <head> tag of every webpage you want to track, ideally before any other script.
Verify Installation
- Return to your GA4 dashboard.
- Check the “Realtime” report to see if data (like page views) is being reported, indicating that the setup is correct. (it might take 24- 48 hours to show the data)
The History of Google Analytics
Google bought a company called Urchin in 2005 and made Google Analytics, a free service that helps you see and improve your website.
Google Analytics has changed a lot since then, following the changes in the web and what people want. Here are some of the big changes in the history of Google Analytics:
- Google Analytics came from Google buying Urchin Software Corporation, a company that made web analytics since 1995 by Scott Crosby and Paul Muret. Urchin made a software called Urchin on Demand, which used JavaScript tags to get and show website data, instead of using server log files.
- Urchin on Demand started in 2003 and became popular among website owners and managers who wanted to see and improve their online performance. Urchin also had a downloadable version of its software, which people could put on their own server and change according to their needs.
- In March 2005, Google bought Urchin for an unknown amount. Google wanted to make web analytics easy and free for everyone and to make it work with its other products and services, such as Google Ads and Google Search Console.
- In November 2005, Google started the first version of Google Analytics, based on Urchin on Demand. Google Analytics was free for anyone who wanted to join, with a limit of 5 million page views per month. However, the demand was so high that Google had to stop new sign-ups and add more servers to handle the traffic. Google Analytics was first criticized for being slow, missing features, and having privacy issues. But Google kept making it better and adding new things, reports, and integrations over the years. Google Analytics also got help from the Urchin team, who joined Google after the buy and stayed involved in making the product.
- In 2007, Google made Classic Google Analytics, which used a new JavaScript snippet, called ga.js, that made tracking better and more reliable. Classic Google Analytics also added new features, such as site search, event tracking, custom reports, and e-commerce reporting.
- In 2009, Google made the Google Analytics Asynchronous Code, which used the same ga.js snippet but loaded it faster, meaning that it did not slow down the loading of other things on the web page. This made the web page and the tracking code faster and better.
- In 2012, Google made Universal Analytics, which used a new JavaScript snippet, called analytics.js, that let you track and measure users across different devices and platforms. Universal Analytics also added new ideas, such as users, sessions, and hits, and new features, such as custom dimensions, metrics, enhanced e-commerce, and user ID.
- In 2017, Google made the Global Site Tag, which used a new JavaScript snippet, called gtag.js, that made it easier to install and set up Google Analytics and other Google marketing products, such as Google Ads and Google Optimize.
- In 2020, Google released the Google Analytics 4 (GA4), which is the newest version of Google Analytics. GA4 is based on the App + Web property that Google made in 2019, which lets you track both web and app traffic in one place. GA4 uses a new measurement model, based on events and parameters, that gets more data and gives you more options and customization. GA4 also uses smart machines to give you insights and predictions, such as how likely users are to leave, buy, or spend.
Google Analytics is very successful because it came from Urchin, a leader in the area of web analytics. Urchin wanted to give everyone easy and strong web analytics, and Google made this happen and made it even better.
Google Analytics in 2024 and Beyond
Google Analytics 4 (GA4) is the newest version of Google Analytics, started in October 2020. GA4 is built on the App + Web property that Google made in 2019, which lets users measure both web and app traffic in one place. GA4 uses a new way of measuring, based on events and parameters, that gets more data and lets you change and adjust it more.
GA4 also uses machine learning and artificial intelligence to make insights and predictions, such as how likely users are to leave, buy, or make money.
What are the key features of GA4?
GA4 is always changing and getting better, adding new things and abilities to make its users happy and satisfied. Some of the new updates and features of GA4 are:
Data Streams
Data streams are where the data comes from that goes into a GA4 property, like websites, apps, or Firebase projects. Data streams let users set and manage their data collection settings, like measurement ID, enhanced measurement, consent mode, and more.
DebugView
DebugView is a tool that helps users fix and check their data collection and configuration. DebugView shows the events and parameters that are sent to GA4 right away, and also any errors or warnings that may happen.
Analysis Hub
Analysis Hub is a tool that lets users make and change their reports and analyses, using different methods and templates, like funnel analysis, path analysis, segment overlap, cohort analysis, and more.
BigQuery Export
BigQuery Export is a feature that lets users export their raw GA4 data to Google’s cloud-based data warehouse, BigQuery, for more analysis and integration. BigQuery Export is free for up to 10 GB of data per month and costs money for more data.
Consent Mode
Consent Mode is a feature that lets users change how GA4 works based on the consent status of their users, like whether they have agreed to analytics or ad cookies. Consent Mode helps users follow data privacy rules, like the General Data Protection Regulation (GDPR) and the California Consumer Privacy Act (CCPA).
Event-based Measurement Model
GA4 uses an event-based measurement model, which means that it tracks and measures user interactions as events, not pageviews or sessions. Events are things that users do on a website or app, like clicking a button, viewing a product, or buying something.
Events can have parameters, which are more details or features that describe the event, like category, value, or currency. GA4 has some predefined events and parameters, like page_view, scroll, and ecommerce_purchase, but users can also make their own events and parameters, to get the data that is important and useful for their business.
Cross-Platform and Cross-Device Tracking
GA4 lets users track and measure user behavior across different platforms and devices, like websites, apps, or Firebase projects, in one property. This lets users have a complete and connected view of their users and their customer journey, and also study and improve their cross-platform and cross-device performance.
It also supports the User ID feature, which lets users give a unique and lasting identifier to their users, and link their activity across different devices and sessions, as long as they log in or sign up on the website or app.
Machine Learning and Artificial Intelligence
GA4 uses machine learning and artificial intelligence to make insights and predictions, based on the data collected and analyzed.
For example, GA4 can automatically find and show important trends and changes in the data, like increases or decreases in traffic, conversions, or revenue. GA4 can also give predictive metrics, like how likely users are to leave, buy, or make money, which can help users know and expect their users’ behavior and results, and do things accordingly.
GA4 can also work with Google’s smart marketing products, like Google Ads and Google Optimize, to let users make and improve their marketing campaigns, based on the data and insights from GA4.
The Impact of Google Analytics
Google Analytics helps you see and improve your website and online business. It has changed how websites and online businesses work in many ways, such as:
- Giving businesses tools that help them see and improve their website and online business with data and insights. Being free and easy to use and work with other Google products and services, such as Google Ads, Google Tag Manager, Google Looker Studio, and more.
- Moving from tracking sessions to tracking users and events, and letting businesses see and improve how users act across different platforms and devices in one place, such as websites, apps, or Firebase projects. Using smart machines to give insights and predictions, such as how likely users are to leave, buy, or spend, and helping businesses know and expect their users’ behavior and outcomes, and act accordingly.
- Changing the web and data privacy rules, such as the General Data Protection Regulation (GDPR) and the California Consumer Privacy Act (CCPA), and giving features such as Consent Mode, which lets businesses change how Google Analytics works based on the consent status of their users.
Some examples of how Google Analytics has helped businesses and industries are:
- The New York Times used Google Analytics to see how well their digital subscription model worked and found that users who read more than five articles per month were more likely to subscribe. They also used Google Analytics to try different headlines, images, and layouts, and improve their user experience and engagement.
- L’Oréal Canada used Google Analytics to combine their online and offline data and make a single view of their customers. They also used Google Analytics to group their customers based on their behavior and preferences and send them personalized and relevant messages and offers.
- Vodafone used Google Analytics to see how their online marketing campaigns affected their offline sales and found that for every online sale, there were nine offline sales. They also used Google Analytics to improve their website design and content and increase their online conversions by 25%.
Controversies Related to Google Analytics
Google Analytics had some problems with keeping people’s data safe and following the rules. Here are some of the well-known controversies Google Analytics had:
- In 2010, Google said sorry for taking people’s data, like emails and passwords, from Wi-Fi networks in many countries, while also getting location data for Google Maps. Google Analytics used some of the data to make its location services better. Google had to deal with many people and groups who were angry and sued them. Google agreed to pay money and delete the data.
- In 2012, Google was blamed for ignoring the privacy settings of Safari and Internet Explorer browsers and putting cookies on users’ devices without asking them. The cookies were used by Google Analytics and other Google services to see what users did online and show them ads.
- In 2018, Google was affected by the “Schrems II” decision from the Court of Justice of the European Union, which said that the EU-U.S. Privacy Shield framework, a way that allowed the transfer of personal data from the EU to the U.S., was not valid. The decision was based on the worries that the U.S. spying laws and actions did not protect the data of EU citizens well enough. Google Analytics, along with other Google services, used the Privacy Shield to transfer data from the EU to the U.S. Google had to use another way, such as standard contractual clauses, to keep transferring data, but faced difficulties and doubts from the EU data protection authorities and the European Data Protection Board.
- In 2020, Google was sued by NOYB, a privacy advocacy group founded by Max Schrems, for allegedly breaking the EU General Data Protection Regulation (GDPR) by using Google Analytics without getting valid consent from users. NOYB filed 101 complaints against various websites that used Google Analytics and said that Google Analytics collected and transferred personal data to the U.S. without telling or asking users. The complaints led to two actions so far, one from the Austrian Data Protection Authority, and the other from Commission nationale de l’informatique et des libertés (CNIL), which fined the websites for using Google Analytics without consent.
Conclusion
Google Analytics helps you see how many people visit your website, what they do there, and how they find you. It started as a small company that Google bought and made better.
Google Analytics keeps improving and adding new things, like tracking users across different devices, measuring events, using smart machines, and respecting user choices. Google Analytics is not just for counting visitors, it is for shaping the web.
It helps websites and online businesses in many ways, like showing them what works and what doesn’t, and how to get better results. Google Analytics is a great tool that can help businesses grow and do well online.


